Huawei Tech4City - Synthetic Network Generation for Conversations Simulation
Why?
For the last 2 months, I’ve been preparing for Huawei’s Tech4City with Võ Khắc Triệu (NUS), Hoàng Phương (NUS), Dương Kiến Khải (NTU). We proposed an integrative solution to existing social media applications to detect harmful messages, and inform users of potential dangers. Inspired by Linkedin’s work, we devised a three-layer mechanism - a small enough BERT-based classifier to quickly check for suspicious activity, an offline graph-embedding classifier from a user’s chat history with higher accuracy, and an LLM-powered explanation to inform the victims of next steps.
We didn’t get in the Semi Finals, but you can access the repo here anyways.
To validate the approach, we did what any AI engineer would do in the big '26 - generate the dataset out from an LLM with hopes and prayers. Kinda?
Synthetic Conversation Generation
We based our data generation around SynBullying, a dataset paper for cyberbullying detection with 25% real and 75% synthetic data from 5 other LLMs, using the real data as seeds.
For our seeds, we used NUSConfessit and NTUConfessit up to June 2026 to perform sentiment analysis - cleanup, embedding clustering, sample clusters for topic summaries. These topics are used as the main idea of every conversation, based on SEAGuard’s dataset generation strategy. Sampling these conversations also help to few-shot Singlish texting patterns, also good enough.
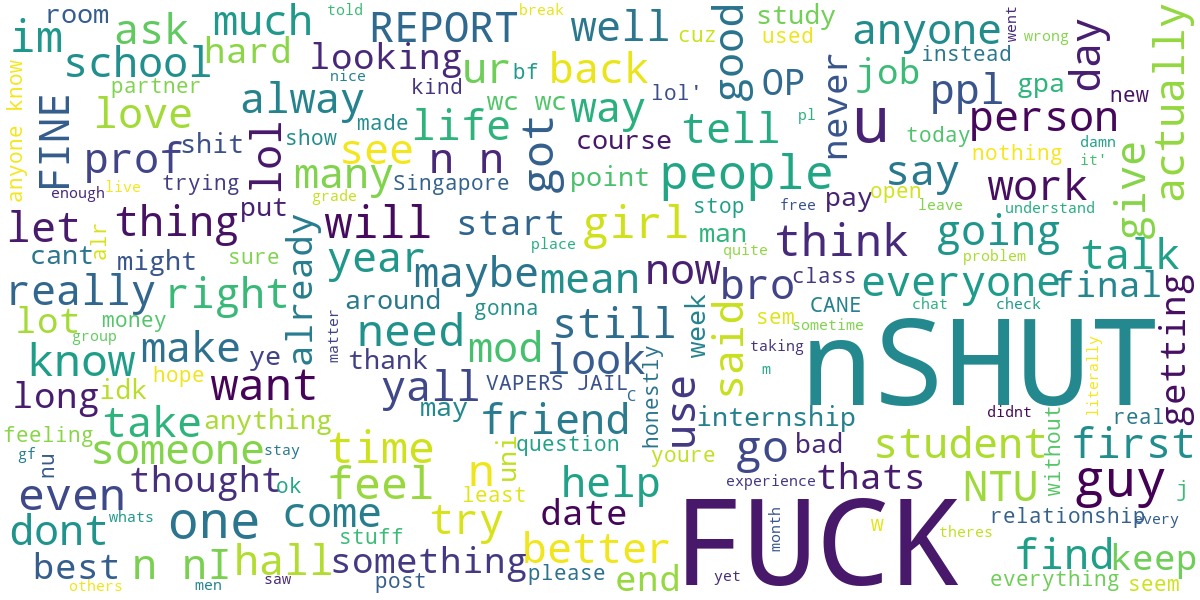
Here’s the word cloud for NTUConfessit:
And NUSConfessit:
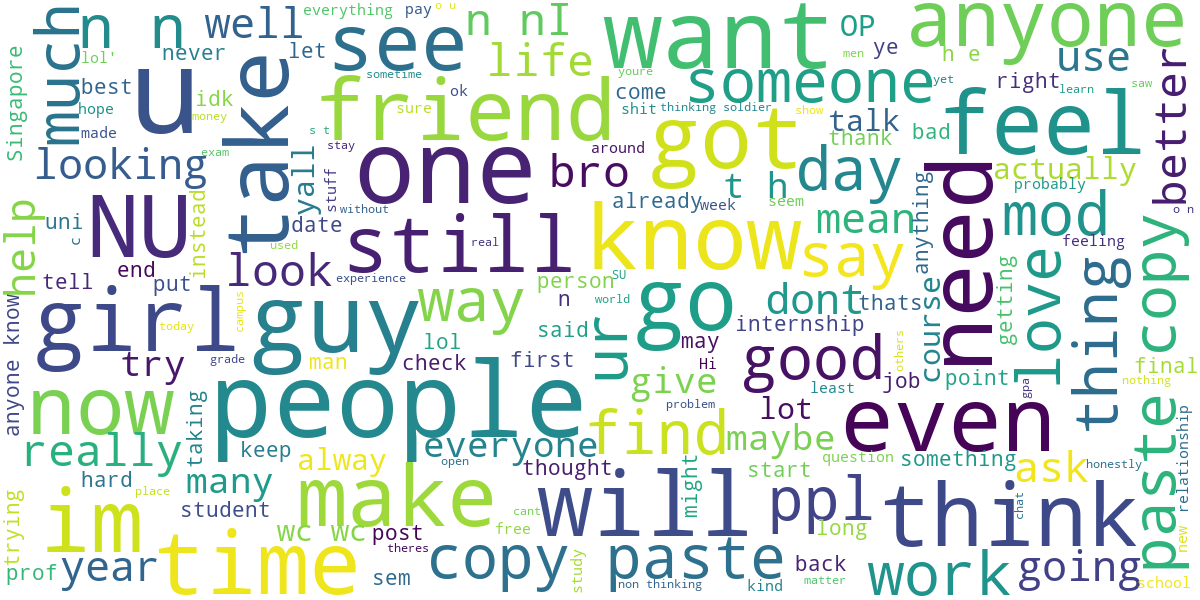
From their Confessit posts, NUS is more “academically intense and CS-heavy, focused on workload, GPA pressure, and performance anxiety. There are themes of career uncertainty and technical competitiveness-driven. Conversation are also structured around academic identity and stress narratives”.
Meanwhile, NTU is more “socially and relationally centered (dating, attraction, hall culture), more casual interpersonal storytelling, more explicit focus on social comparison and identity. Conversations include more lifestyle/chat and emotional relational content”.
Synthetic Social Network Generation
Originally, we assumed the graph would figure itself out if the IDs are assigned uniformly at random, with enough samples (big data moment). That was not the case, classification results did not improve from layer 1.
Our next assumption is that a natural social network with preassigned “bullies” would provide stronger signals. So, how do we generate synthetic social networks?
This article helped alot for studying synthetic network generation.
It is convenient to generate your own dataset and not worry about things such as controlling the size of the graph, privacy and data sharing restrictions, and graph data format. Synthetic graphs provide a quick way to test your algorithms, and after developing a framework, you can deploy them onto real-world scenarios.
Synthetic graphs are generated using graph generative models. They are constructed to mimic real-world graphs as closely as possible. There exist algorithms that generate synthetic graphs. Some of these are: Erdös-Rényi model, Watts-Strogatz model, Barabasi-Albert model.
import networkx as nx
import numpy as np
import matplotlib.pyplot as plt

# Erdos-Renyi model
G1 = nx.erdos_renyi_graph(n=50, p=0.2, seed=42)

# Watts-Strogatz model
G2 = nx.watts_strogatz_graph(n=50, k=5, p=0.4, seed=42)

# Barabasi-Albert model
G3 = nx.barabasi_albert_graph(n=50, m=5, seed=42)

# plot side by side
fig, ax = plt.subplots(1, 3, figsize=(15, 5))
# add title to each plot
ax[0].set_title('Erdos-Renyi')
ax[1].set_title('Watts-Strogatz')
ax[2].set_title('Barabasi-Albert')
nx.draw(G1, ax=ax[0])
nx.draw(G2, ax=ax[1])
nx.draw(G3, ax=ax[2])
plt.show()
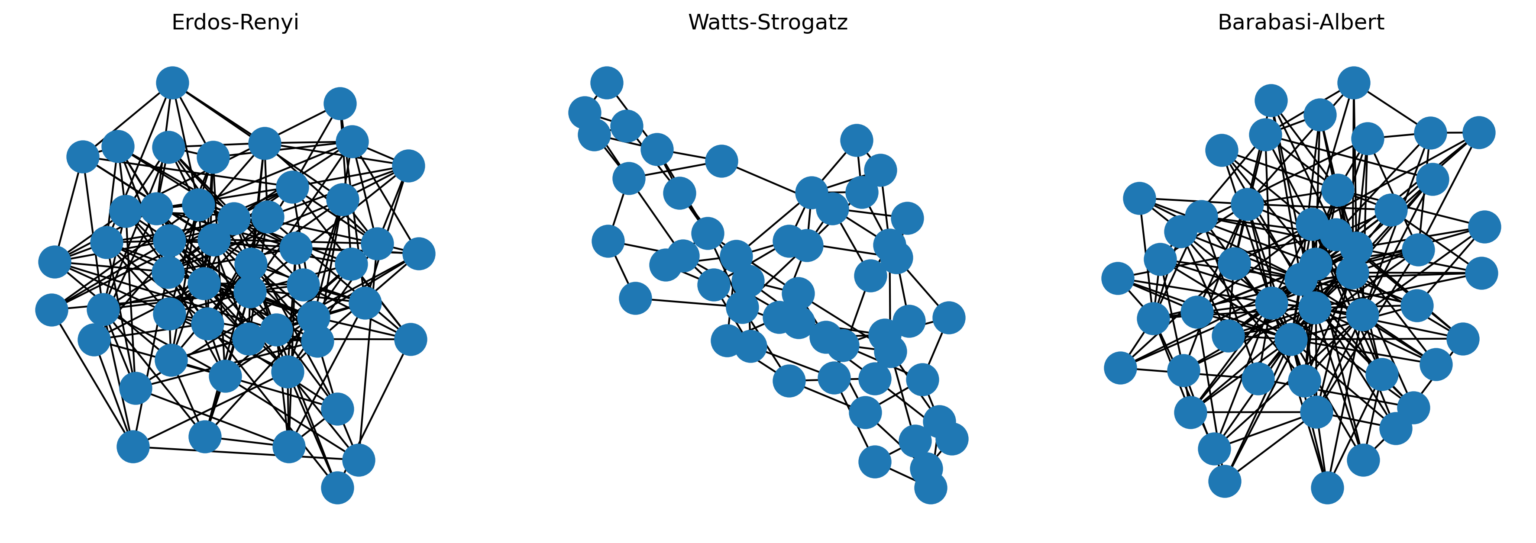
We decided to opt for the Watts-Strogatz generation model because it is used for “generating graphs with a small-world property”, which is enough for our experiment. We tried using Erdo-Renyi at the beginning too, but results were poor and the article mentioned that “this is a simple model and does not come close to a real-world graph”.
This is a way of generating graphs with a small-world property. In this context, a small-world is defined as something that has a small path length and a high clustering coefficient.
This model starts with a regular grid-like structure with a fixed number of nodes and connects edges from a node to its nearest neighbors. It uses a rewiring probability which means that some edges are randomly removed from a place and added elsewhere.
Algorithm
Seed data comes from public campus topics (NUSConfessit, NTUConfessit) and SEA-Guard / SynBullying-style pipelines. We clustered topics, assigned graph IDs by sampling from the Watts-Strogatz model, and marked toxic-user patterns to test repeated behavior.
A snippet from utils/conversation_agent.py:
def build_conversations(
		..., samples_per_topic_id = 100, num_users = 2000, bully_ratio = 0.1
):
		# ...

		# assign user ids, random bully ids from a ratio of users,
		# and a random watts strogatz graph
	  user_ids = range(num_users)
    bully_ids = random.sample(user_ids, int(num_users * bully_ratio))
    G = nx.watts_strogatz_graph(n=num_users, k=10, p=0.4, seed=42)

	  # For every topic
    for topic_id, topic in topics.items():
		    # Get the topic sentence, duplicated for the number of conversations
		    # for each topic to be generated
        topic_kmeans_ids = [
            x["topic_id"] for x in topic_class_data[topic_id]
        ] * samples_per_topic_id

        def generate_from_llm(kmeans_id):
		        # Get the seed messages assigned to that topic
            cluster_samples = text_to_topic[int(kmeans_id)]

						# We sample at most 5 messages
            n = min(5, len(cluster_samples))
            samples = random.sample(cluster_samples, n)

            # Assign a conversation to have 1-2 bullies
            bully_chat_ids = random.sample(bully_ids, random.randint(1, 2))

            # Assign a conversation to include users the bullies have talked to
            # aka, graph neighbours
            groupchat_ids = []
            for id in bully_chat_ids:
                groupchat_ids.extend(G.neighbors(id))
            groupchat_ids = list(set(groupchat_ids))

            # Anyone in the groupchat id set that isn't a bully is either a victim,
            # a bystander or supporting roles
            supporter_ids = [x for x in groupchat_ids if x not in bully_chat_ids]

            # include sample_text, topic bully_chat_ids, supporter_ids
            # through an LLM and get its response as a structured json output
            sample_text = "\n".join(samples)
            response = ...

            output = response.output_parsed
            conversation[topic_id].append(output.model_dump(mode="json"))

				# run concurrently with 10 workers for speedup,
				# build len(topics) * samples_per_topic_id conversations
        with ThreadPoolExecutor(max_workers=10) as executor:
            futures = [
                executor.submit(generate_from_llm, kmeans_id)
                for kmeans_id in topic_kmeans_ids
            ]

            for future in tqdm(as_completed(futures), total=len(futures)):
                future.result()

    # ...
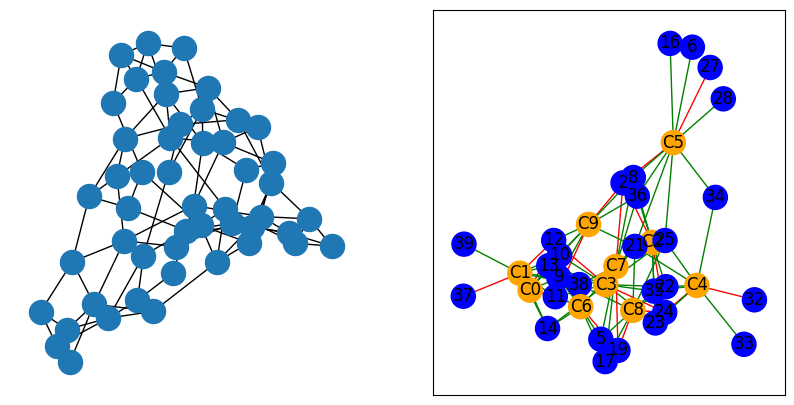
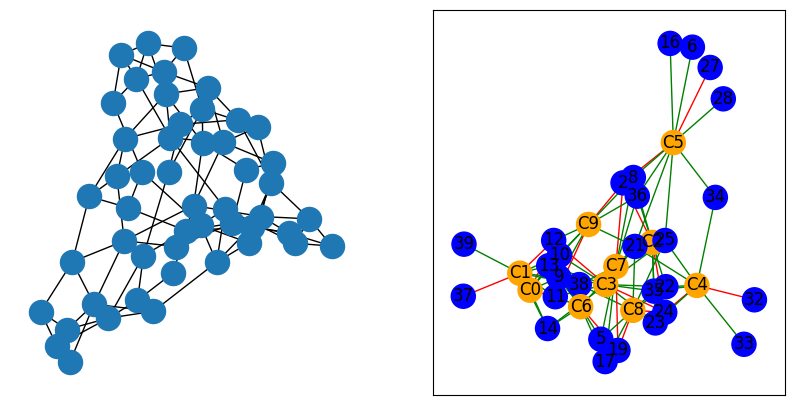
From the resulting social network, this is what a subgraph looks like, compared to its original sampled Watts-Strogatz graph. The blue nodes stand for users, and the yellow nodes stand for conversations. The red edge assigns the user as a bully of the conversation.
Declaration
Absolutely no LLMs were used in the modeling and algorithmic design for this portion of the project, yippi! The use of LLMs are strictly limited to topic synthesis and conversation synthesis from real seed messages.
Outro
This was a fun 2-month project with the kids, showing them around software development cycles, data modeling, product design, graph modeling. Still a shame Huawei didn’t pick us up, damn. Really proud of the idea of graph sampling for synthetic world modeling. There’s totally other projects that do this, do tell me more about them.
